
Robot Market Data Practice: Keep TSV Values and Flags Together
2026-11-02
Robot Market Data Practice: Keep TSV Values and Flags Together
TSV values can carry status information that should remain attached when an analyst reads a prepared statistical extract. Removing a flag to make a column look numeric may discard part of the source’s meaning. This practical article proposes a format-reading lesson using Eurostat’s documentation. It downloads no dataset and reports no robotics market figure. The task is to explain a value’s representation and status before considering any later analysis.
Identify the format before interpreting the cell
Begin with the stated source and format of the prepared material. A tab-separated file is not automatically governed by every convention used in another provider’s tabular export. The learner should identify the applicable documentation rather than infer semantics from the file extension alone.
The Eurostat guide to available formats describes its TSV representation as a flat file with a time series on each line. That is a useful structural reference for this exercise. It does not establish that any particular robotics observation is available in a file.
The fictional lesson should therefore name its purpose as format reading. Do not populate it with invented official counts, countries, or years to make it resemble an empirical market report. Understanding a representation is useful without pretending that a dataset has been examined.

Keep the value and its attached flag distinguishable
The format guide explains that flags can be attached to values and that a blank separates the value from the flag. A learner should preserve both parts in the reading note. The separation allows them to be distinguished; it is not an instruction to throw the status information away.
Ask what the flag means in the relevant source context. A short letter needs its documented definition and any applicable dataset metadata. Keep an unresolved flag meaning beside the original cell rather than hide it in a general note about data quality. That makes the precise reading question available to the person reviewing the source documentation. Do not replace a flag with a guessed assessment of accuracy or treat every marked value as unusable.
The Eurostat TSV API FAQ illustrates a provisional-status flag in its explanation. This is documentation of a representation, not a current observation about a robotics series. The lesson uses the documented concept without copying example values into a new market claim.
Carry series context with the observation
A value and flag still need the series and period context to be interpretable. The learner should identify where the prepared representation carries that context before copying a cell into a separate note. A detached numeric-looking token is not a complete statistical statement.
The FAQ describes one time series per line and explains multiple-frequency cases. That means a reading exercise should not assume that every neighboring time column is applicable to every series in the same way. Consult the actual series key and documentation before making that judgment.
This article examines no actual series key and computes no result. It makes no assertion about installation totals, growth, market share, or comparisons between countries. Those questions require an appropriate real dataset with its scope and observation context intact.
Describe the transformation before making a numeric view
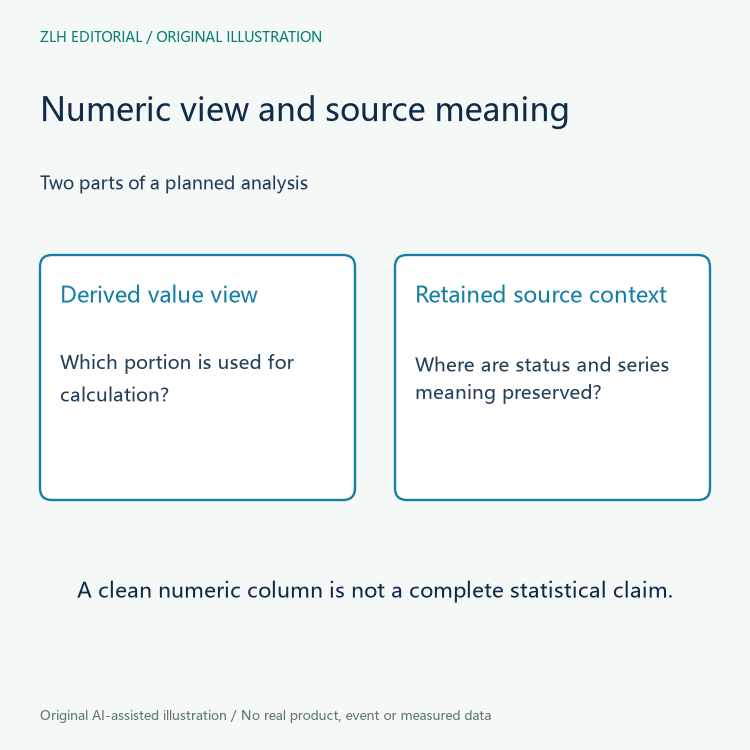
If a later authorized analysis needs a numeric representation, document how the original value, flag, and context are retained. A clean-looking column should not erase the information needed to explain the source. Keep the original extract available beside any derived analytical view.
Ask another learner to trace a proposed analytical item back to its original representation. They should be able to identify the value portion, the status information, and the relevant series and period. If one disappears during copying, revise the handling plan before calculation.
The exercise does not prescribe a parser or claim that a conversion has succeeded. It identifies the meaning that a later implementation must preserve. Technical parsing and the suitability of an observation for a particular market question remain separate review tasks.
Keep the final statistical claim outside the format lesson
A reader who understands a flag has learned something about the documented status representation. That does not automatically determine whether an observation answers a robotics-market question. Definitions, coverage, and the intended comparison still matter.
The proposed summary should retain the source format, the value-and-flag relationship, and the unresolved dataset questions. It should not turn a documented example into a new official statistic. No forecast or empirical comparison is produced by this article.
Related methods appear in our robotics industry-data section and the article directory. Both original illustrations are conceptual, with no actual Eurostat rows, measured values, market rankings, or calculated results.