
Robotics Market Averages: Explain the Weight Assigned
2026-11-04
Robotics Market Averages: Explain the Weight Assigned
Robotics market averages can answer different questions even when their input tables look similar. One summary may give every reporting organization the same influence. Another may assign influence according to the number of observations associated with each organization. Before reading a weighted average as an industry measure, identify what receives the weight and why. The software function can calculate the declared expression, but it cannot supply the business meaning of an unexplained weight column.
State what one observation contributes to the summary
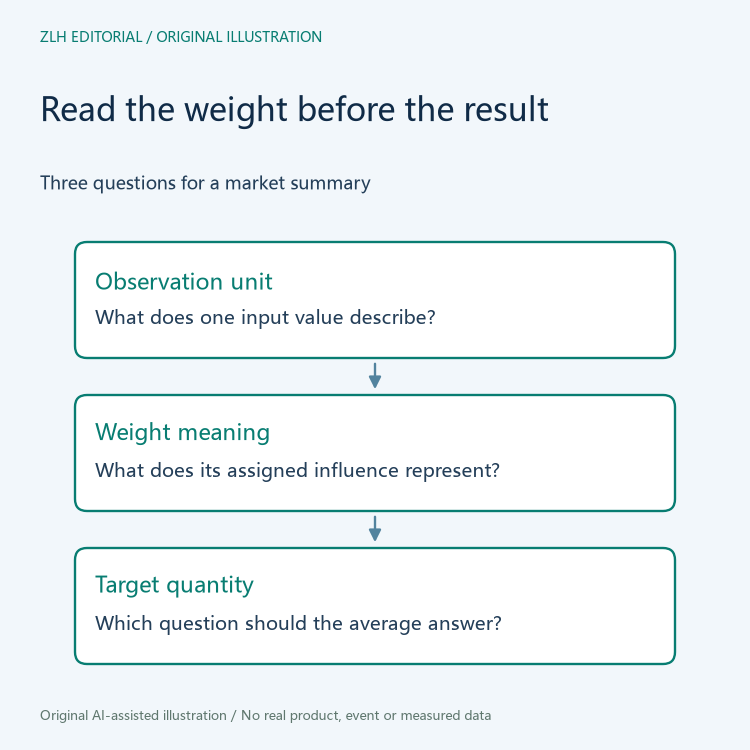
Begin with the unit represented by a row. It might describe a respondent, a category-period observation or a previously summarized group. Those structures cannot be treated as interchangeable merely because they all contain a value and a weight. The reader needs to know whether the proposed average is about the participating organizations, the underlying observations or some other defined population.
Imagine a hypothetical market worksheet containing one summary value per contributor. Giving every contributor an equal weight answers a different question from weighting by each contributor's represented observations. Neither choice is automatically correct for every report. The analyst should name the intended question before choosing a calculation and should explain whether the submitted summaries are comparable enough for that question.
This distinction is particularly useful when a headline says average adoption or average activity without specifying its unit. Ask what an individual contribution means and whether contributors overlap in the material they represent. A weighted formula does not remove overlap or create a complete industry census. Those are source-coverage questions that remain part of the statistical account.
Read the formula together with the weight definition
The official NumPy average documentation describes weighting each included value and dividing the sum of weighted values by the sum of weights. It also explains that omitting weights treats values as having equal weight. That documented calculation tells a reader how the numerical expression is formed; it does not say what a robotics-market weight should represent.
A weight might encode a count, a stated analytical importance or another declared convention. Preserve that meaning in words and retain its source. Do not label an importance score as a sample size because both happen to be numeric. If the supplied material does not explain the weight, record the missing definition and request clarification before publishing a substantive market interpretation.
Keep alignment and array structure visible
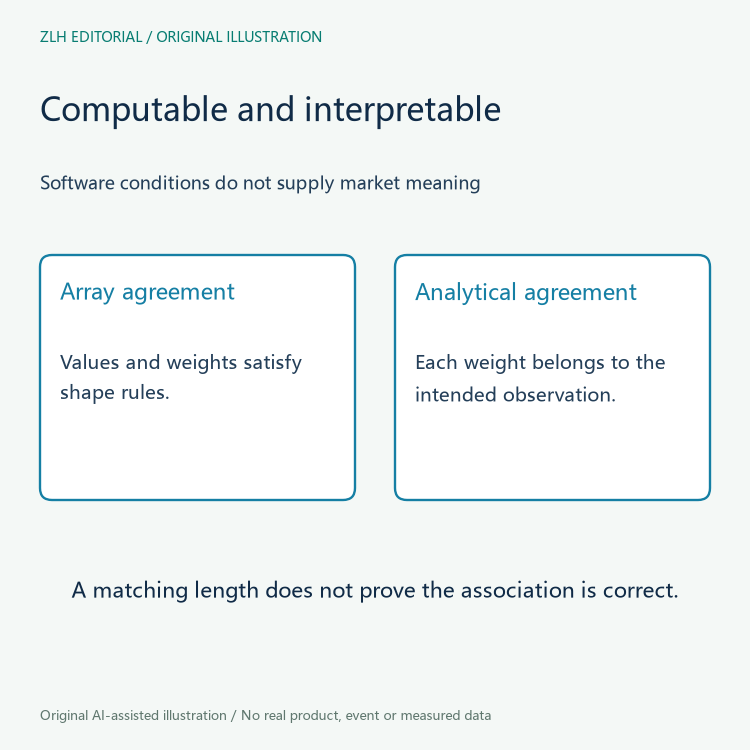
The same NumPy reference sets out shape requirements for weights and values and explains the role of the selected axis. In the official Python statistics documentation, fmean supports optional weights and requires a supplied weight sequence to match the data's length. These are implementation conditions for the respective functions, not guarantees that the right weight belongs beside each observation.
A table can satisfy a length requirement while pairing a value with another row's weight. The editorial response is to retain the association through the data preparation steps. Identify the key used to connect each value and weight, and describe any reordering or exclusion applied before calculation. A successful function call would not, by itself, establish that those associations were substantively correct.
No arrays have been executed for this article. If a project later compares two implementations, it should preserve the same selected observations, weights and intended axes before interpreting a difference. A discrepancy is a reason to inspect those choices and the software context, rather than an automatic indication that the underlying robotics market has changed.
Explain the denominator instead of hiding it
NumPy's reference documents an option to return the sum of weights alongside the average. That total can help describe the calculation when its meaning is stated clearly. It should not automatically be called the number of robots, respondents or installations. The appropriate label depends on what the weight actually encodes and which observations were included.
The documented expression also requires a nonzero sum of weights. That mathematical condition is separate from whether the weights make sense for the report's question. A technically calculable expression can still answer an unintended question. Preserve exclusions and unresolved definitions in the method note rather than allowing the existence of a numerical result to stand in for a complete analytical explanation.
Publish the analytical question beside the result
A useful method statement identifies the observation unit, the weight source, the eligibility rule and the calculation context. If the input consists of group summaries, say so and explain the relationship to the intended overall quantity. Avoid a generic claim that weighting makes the result representative: that conclusion needs a justified design and evidence about coverage, which these software references do not provide.
The original figures contain no market values and imply no completed computation. More methodological discussion is available through the robotics market data collection and the article directory. A weighted average becomes interpretable when the reader can tell what was weighted, how the associations were retained and which population the resulting sentence is intended to describe.