
Robotics Data FAQ: Seasonal Adjustment and Calendar Effects
2026-11-05
Robotics Data FAQ: Seasonal Adjustment and Calendar Effects
Seasonal Adjustment and calendar adjustment can appear beside industrial indicators used in a robotics market briefing. Those labels help define what a series means. They should not disappear when a table is copied into a presentation, and they should not be added to an annual robot count without evidence. This FAQ reads Eurostat's short-term business statistics material as an example of adjustment terminology. It calculates no series, reports no robot-market growth figure and makes no prediction about equipment demand.
What does seasonal adjustment aim to remove?
Eurostat's Seasonal adjustment glossary entry describes a statistical method for removing effects of recurring seasonal influences observed in the past from an economic time series. Its purpose is to make non-seasonal developments clearer. The glossary also explains that seasonal influences differ across activities, economies and indicators. A shared adjustment label does not make all economic series equivalent.
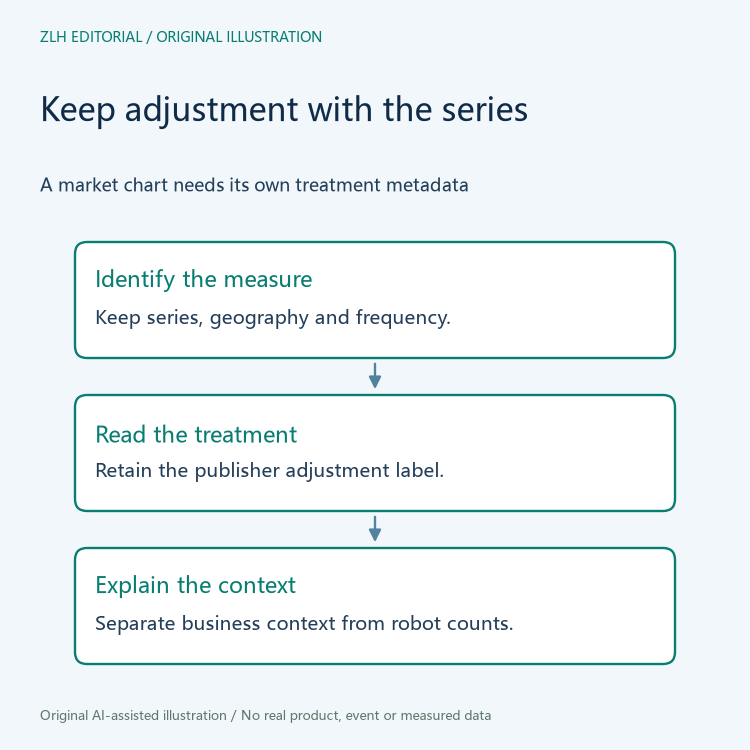
A robotics analyst may use a broader manufacturing indicator to provide context for a report. The adjustment label belongs to that particular indicator, not automatically to every nearby robotics series. Keep the measure, classification, geography and time frequency with the label. Otherwise a presentation can make an industrial context series look like a directly comparable record of robot installations.
Consider a hypothetical briefing with a monthly business indicator and a separate annual robot table. An editor copies the monthly chart's adjustment note into the robot table. The appropriate correction is to restore the source-specific labels and ask what the robot source actually states. This fictional example contains no data or growth result; it illustrates a metadata transfer that would need review.
How is calendar adjustment described in this source?
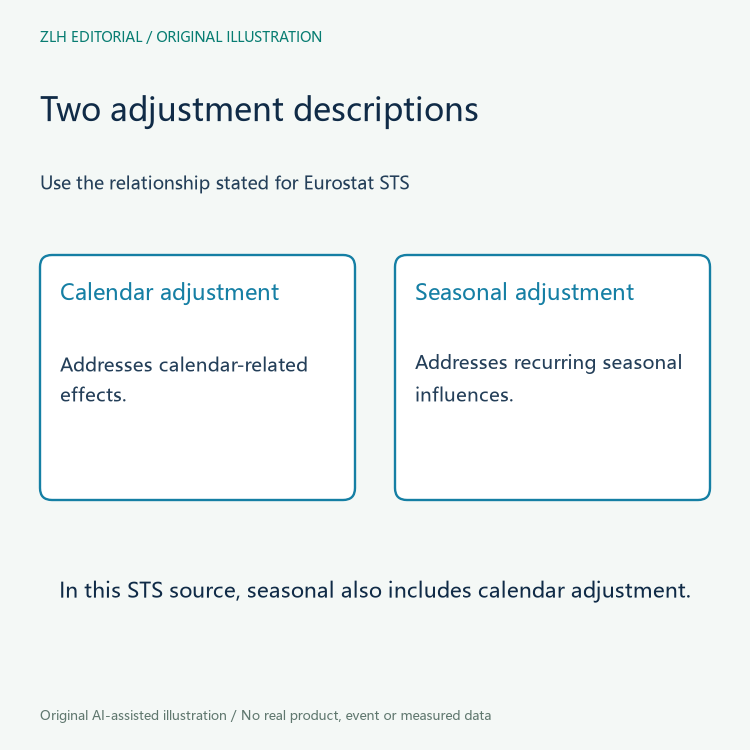
Eurostat's Short-term business statistics information page describes calendar adjustment as removing effects associated with different numbers of holiday days and weekends in different months. It separately discusses seasonal adjustment. In that STS context, the page states that seasonally adjusted data are also calendar adjusted, while the converse does not hold.
That relationship should remain tied to the stated statistical context. A label saying calendar adjusted does not by itself justify relabeling a series as seasonally adjusted. Equally, an analyst should not treat the absence of one phrase in a shortened chart legend as a complete account of the source method. Return to the series metadata and preserve its exact adjustment description.
Can differently adjusted series be compared without comment?
A comparison should explain the series choices and the analytical question. If one curve is unadjusted and another is seasonally adjusted, their different treatment is part of the interpretation. The reader needs to know which developments the chart is intended to show. A visual similarity or difference between curves does not, on its own, establish a robotics-specific explanation.
For a data handover, request the series identities, adjustment categories and reference periods before asking for a headline. If the chart author intentionally chose different treatments, record the reason. If the choice was accidental, preserve the original and describe the proposed correction. Do not silently switch the series and leave the caption claiming the same evidence.
Does an adjusted series stop changing after publication?
No such promise follows from the label. The STS information page lists re-estimation of seasonal adjustment coefficients among the reasons published data can be revised, alongside other reasons. A later download may therefore need a new source record. A revision should be examined through the publisher's explanation rather than assumed to be a newly observed market event.
Retain the access date and dataset edition or download identity used in a briefing. If an author compares two releases, establish that the series definition and treatment are still aligned. This article does not determine why any particular value changed. It explains why adjustment metadata and release context belong beside the values when that question is investigated.
What should a robotics-market caption make clear?
State what the indicator measures, which adjustment label the source gives it and how it relates to the separate robotics evidence. If it is background economic context, describe it that way. An industrial index is not made into a robot count by appearing in a robotics report. Preserve missing methodological information as an open question rather than filling it with a familiar label.
A reviewer can also ask another reader to identify the treatment from the final chart alone. If the reader cannot tell which series is adjusted, the caption may need repair even when the underlying table is intact. That is an editorial finding about interpretability, not a new statistical result.
The sources were read on November 4, 2026. The original illustrations show no market curve or measured change. Further material is available in the robotics market data collection and article directory. Accurate Seasonal Adjustment language keeps a context indicator useful without giving it an unsupported robotics meaning.